Market Snapshot: April 2025
Summary
Volatile Tariffs = Volatile Markets
- Volatility in Markets continued in April with sharemarkets almost 20% lower from previous highs around mid-April before clawing back some of the lost ground as initial tariffs were either wound back or indications of their reduction came through. Interestingly the Australian sharemarket produced a strong positive return of ~3.6% and Australian listed property (REITs) bounced back after a difficult quarter to be the best performing asset class with an April return of 6.4%.
- Once again, Cash and Bonds were the safe haven with positive returns. Bonds are proving again they can be a good diversifier with a weakening economic outlook, although volatility is still likely if there is any short-term inflation (more USA, probably less so Australia).
- The market pricing for Australian Cash rates suggests some monetary stimulus is coming including a May reduction and a likely cash rate around 3.1% by the end of 2025.
- Once again, whilst sharemarket volatility is likely to continue in the short term we don’t know how this lands and it is essential sharemarket investors do not panic sell as we do not know if most of the decline is complete, and we do not know when markets will turn around.
- Our core investment message today is to maintain diversification with focus on the long term and not the current volatility (acknowledging its always easier said than done). Major risks currently lie with expensive sharemarkets, including large companies of the USA, and we continue to favour quality (i.e. good profitability) and value (i.e. “cheap”) styles for long term investments in shares. Quality bonds continue to show good value, and this volatile period is only starting to show new investment opportunities.
Chart 1 … Oil indicating weak growth outlook … and another poor month for global shares
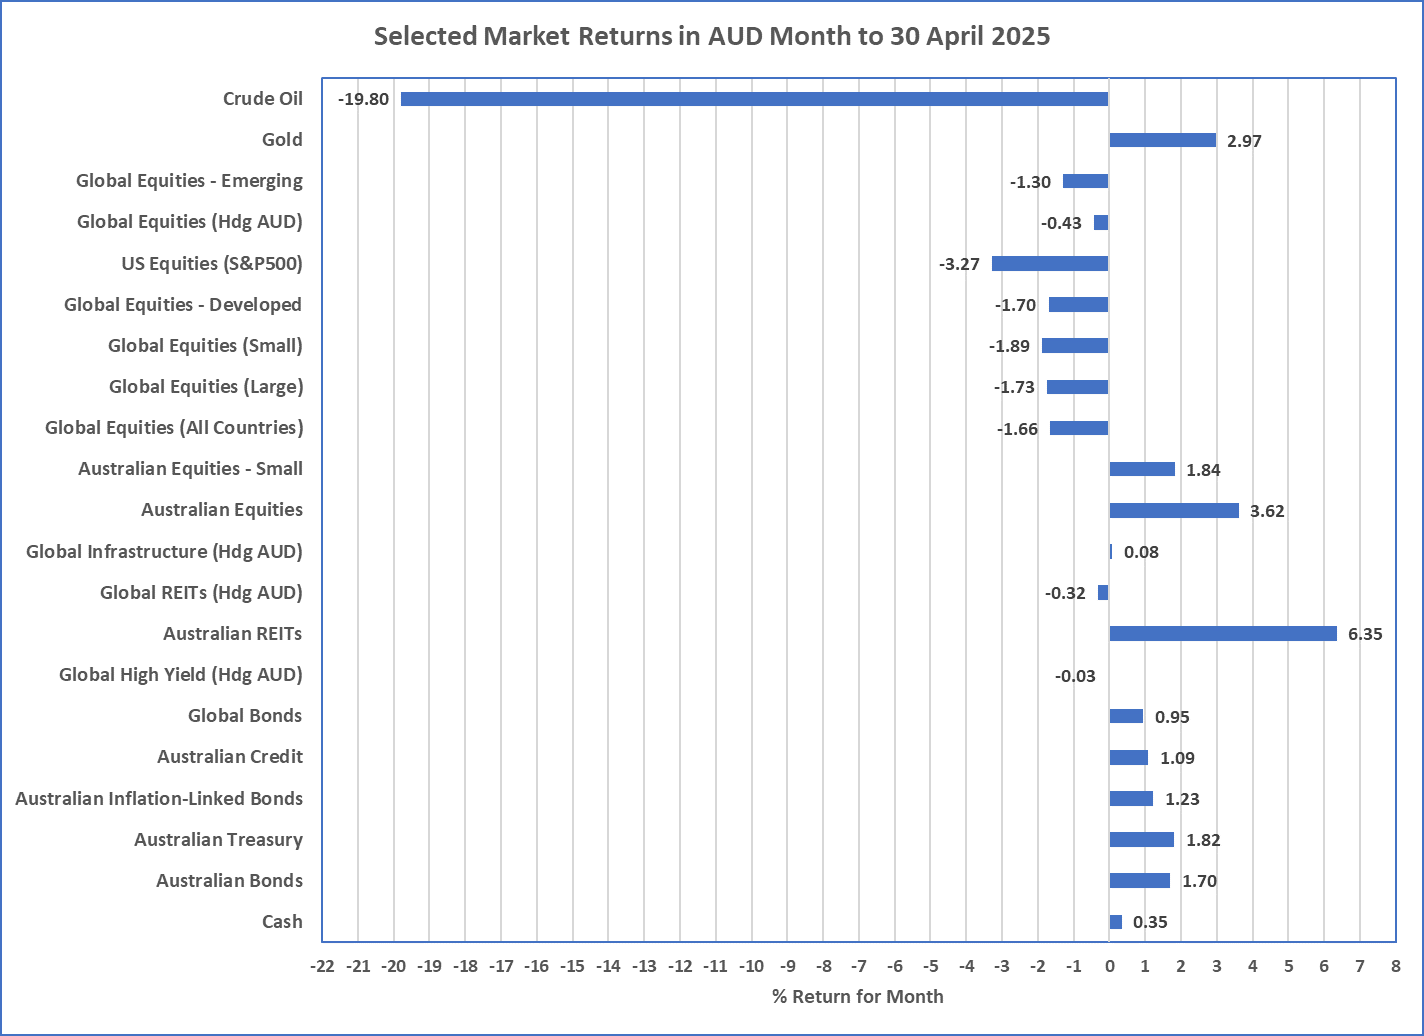
Source: Morningstar
What happened last month?
Markets & Economy … it’s all about Tariffs
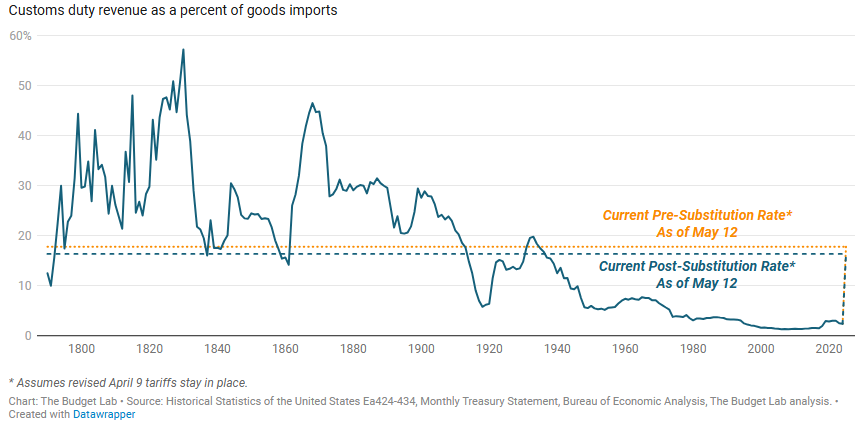
- 2 April was the so-called, “Liberation Day” which was the USA’s global announcement of tariffs to every country in the world including Heard Island. An island of no humans, but definitely penguins, who received a 10% tariff thanks to being an Australian territory. The first chart on Page 4 in this report shows these are the biggest tariff changes in at least 100 years.
- Strangely, the formula of tariffs applying to different countries only had a little bit to do with the tariffed country’s own tariff policy and appeared to also relate to broad sales taxes, and trade deficits. An example of this unusual approach is that it makes little sense for the USA to apply tariffs to exports of diamonds from a poor country like Mozambique given the USA doesn’t produce diamonds, as it just makes the diamonds more expensive in the USA.
- Because Tariffs are ultimately inflationary and economic growth reducing to the USA, and economically damaging to the foreign exporter, naturally sharemarkets around the world sharply declined, with the S&P500 declining around 20% from its previous highs.
- Initially the US Dollar increased in strength (which is usual for a sharemarket sell-off) but then it started to weaken as countries and investors decided to “sell USA”. This resulted in bonds being sold, therefore US interest rates increased and resulted in Trump reigning in some tariffs until markets calmed.
- Since 2 April, tariffs have changed frequently including China’s which increased to 145% and are now back to 30% (12 May 2025). These ongoing tariff changes and related uncertainty will not induce countries to manufacture in USA and some manufacturers have already started to lay off staff. It is rare for every part to be sourced from within the USA, so tariffs even negatively impact input priced for USA Manufacturers.
- In terms of economic data … USA produced a negative March quarter for its economy, unemployment stays low at 4.1%, and inflation is perfectly placed at 2.4%.
- For Australia, it has not imposed any tariffs on USA but may receive a negative growth impact as some exports are exposed. Australia’s unemployment is low at ~4.1%, economic growth for the March quarter is not yet available, and inflation is well positioned at 2.4%. This positions the Reserve Bank well for more interest rate reductions in 2025.
Outlook … Continued Volatility most likely
- With sharemarkets bouncing back, the USA market continues to be priced for very high growth despite an expected decline in economic growth. For the USA tariffs will bring higher inflation and the word stagnation (meaning stagnant economy and high inflation) will likely be frequently aired. As a result, high inflation from tariffs will likely mean the Federal Reserve, much to Trump’s frustration, may discontinue their rate cuts and US interest rates may stay or potentially increase. Either way, the recent high volatility of all markets is likely.
- In Australia, the Reserve Bank is on course for more rate reductions and markets are currently pricing in a cash rate of around 3.1% by December 2025. This action should assist the Australian economy as it will not be immune to declining global economic growth if tariffs stay high. Australian sharemarkets are priced a little better than the USA but it too, is likely to maintain higher than usual volatility as global trade uncertainty persists.
- Overall, the general portfolio preferences are unchanged and centres on diversification. Volatile markets are likely to continue over the next few months, and diversification continues to be essential in this environment, whether shares, bonds, real assets, as well as across regions and broader asset class levels. Over the long-term, valuation matters and this continues to be another central theme for investment today.
Major Market Indicators
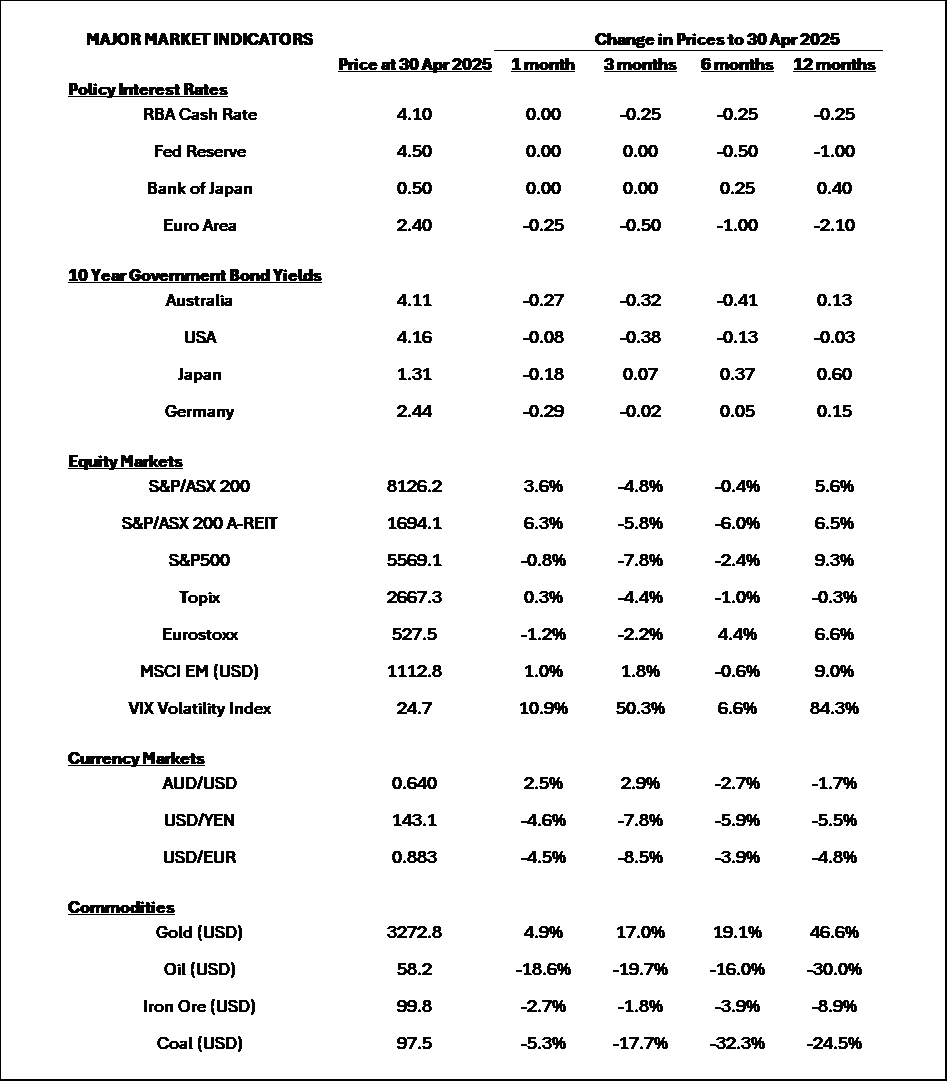
Sources: Morningstar, Trading Economics, Reserve Bank of Australia
U.S. Average Effective Tariff Rate since 1790
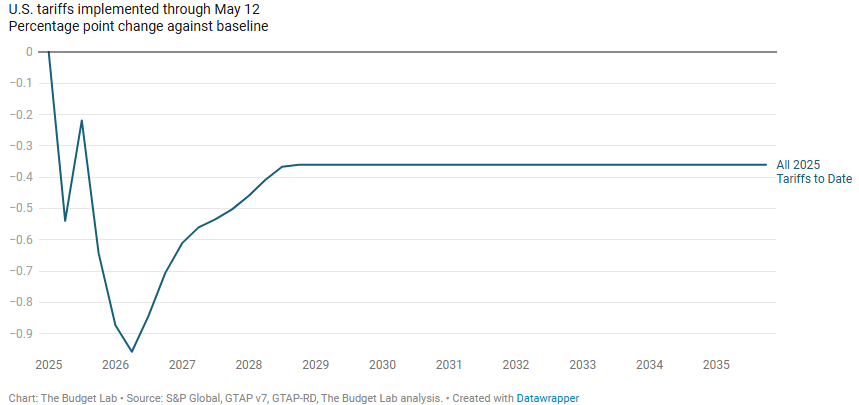
U.S. Real GDP Level Effects of 2025 Tariffs to Date
Long-Run Change in Real GDP Level from 2025 Tariffs to Date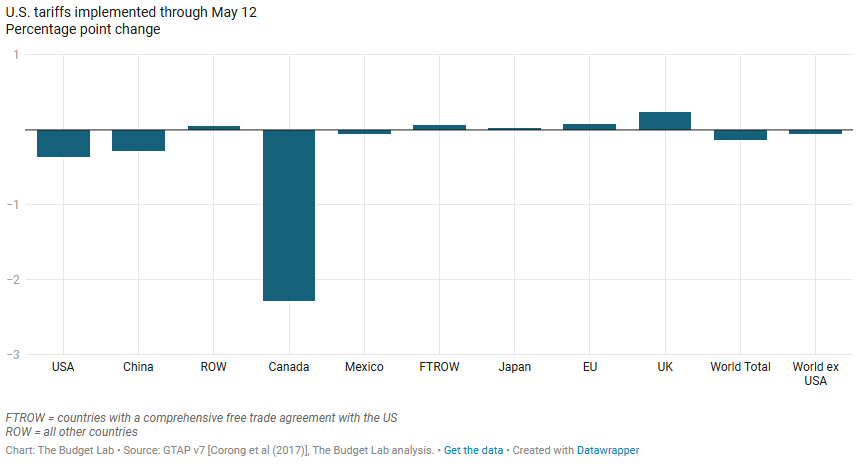
Source: https://budgetlab.yale.edu/research/state-us-tariffs-may-12-2025
McConachie Stedman Financial Planning Pty Ltd is a Corporate Authorised Representative of MCS Financial Planning Pty Ltd | ABN 11 677 710
600 | AFSL 560040
General Advice Warning
The information provided in this article is for general information purposes only and is not intended to and does not constitute formal
taxation, financial or accounting advice. McConachie Stedman does not give any guarantee, warranty or make any representation that the
information is fit for a particular purpose. As such, you should not make any investment or other financial decision in reliance upon the
information set out in this correspondence and should seek professional advice on the financial, legal and taxation implications before
making any such decisions.